

Hacking Together a Simple Graphical Python Debugger
Zero-to-Debugging in 15 mins
You don’t realize the value of a debugger until you’re stuck working on a hard-to-visualize problem. But once you fire up a development environment with decent debugging capabilities, you’ll never look back.
Want to know where you’re at in code execution? What’s taking so long? Just pause it and check.
Wonder what value is assigned to that variable? Mouse over it.
Want to skip a bunch of code and continue running from a different section? Go for it.
Sometimes print(variable_name) is just not enough to give you an idea of what’s going on with your project. This is when a good debugger can help you figuring things out.
Python already gives you a built-in debugger in the form of pdb (a command line tool). But thanks to Python’s awesome community, there are a more options that feature graphical interfaces. And there are a ton of Integrated Developer Environments (IDEs) that work with Python, such as JetBrain’s PyCharm, Wingare’s WingIDE, and even Microsoft’s Visual Studio Community.
But you’re not here to hear how one debugger is better than another, or which one is prettier, or more elegant. You’re here to learn how simple it is to write a python debugger that steps through your code. That gives you a glimpse into Python’s internals.
I’m going to show you how you can build one, and in doing so scratch an itch I’ve had for a long time.
Now let’s get to it.
A quick primer on how Python code is organized and processed
Contrary to popular belief, Python is actually a compiled language. When you execute code, your module is run through a compiler that spits out bytecode which is cached as .pyc or __pycache__ files. The bytecode itself is what
later is executed line by line.
In fact, the actual CPython code that runs a program is nothing more than a gigantic switch case statement running in a loop. It’s an if-else statement that looks at an instruction’s bytecode, then dispositions it based on what that operation is intended to do.
The executable bytecode instructions are internally referenced as code objects, and the dis and inspect modules are used to produce or interpret them. These are immutable structures, that although referenced by other objects — like functions — do not contain any references themselves.
You can easily look at the bytecode that represents any given source through dis.dis(). Just give it a try with a random function or class. It’s a neat little exercise that’ll help you visualize what’s going on. The output will look something like this:
>>> def sample(a, b):
...     x = a + b
...     y = x * 2
...     print('Sample: ' + str(y))
...
>>> import dis
>>> dis.dis(sample)
2       0 LOAD_FAST                0 (a)
        3 LOAD_FAST                1 (b)
        6 BINARY_ADD
        7 STORE_FAST               2 (x)

3      10 LOAD_FAST                2 (x)
       13 LOAD_CONST               1 (2)
       16 BINARY_MULTIPLY
       17 STORE_FAST               3 (y)

4      20 LOAD_GLOBAL              0 (print)
       23 LOAD_CONST               2 ('Sample: ')
       26 LOAD_GLOBAL              1 (str)
       29 LOAD_FAST                3 (y)
       32 CALL_FUNCTION            1 (1 positional, 0 keyword pair)
       35 BINARY_ADD
       36 CALL_FUNCTION            1 (1 positional, 0 keyword pair)
       39 POP_TOP
       40 LOAD_CONST               0 (None)
       43 RETURN_VALUE
Notice that each line in bytecode references its respective position in source code on the left column, and that it’s not a one-to-one relationship. There could be multiple smaller — one could even say atomic — operations that makeup a higher level instruction.
A frame object in python is what represents an execution frame. It contains a reference to the code object that’s currently executing, the local variables that it’s running with, the global names (variables) that are available and references to any related frames (like the parent that spawned it).
There are lot more details about these objects to discuss here, but hopefully this is enough to wet your appetite. You won’t need much more for the purposes of our debugger, though you should check out the Diving Deeper section for links on where to look next.
Enter the sys module
Python provides a number of utilities in its standard library through the sys module. Not only are there things like sys.path to get the python path or sys.platform to help find details about the OS in which you are running, but there’s also sys.settrace() and sys.setprofile() to help write language tools.
Yes, you read that right. Python already has built-in hooks to help analyze code and interact with program execution. The sys.settrace() function will allow you to run a callback whenever execution advances to a new frame object and gives us a reference to it, which in turn provides the code object you’re working with.
For a quick example of how this looks, let’s reuse the function from earlier:
def sample(a, b):
    x = a + b
    y = x * 2
    print('Sample: ' + str(y))
Assuming that every time a new frame is executed, you want a callback that prints the code object and line number its executing, you can define it as:
def trace_calls(frame, event, arg):
    if frame.f_code.co_name == "sample":
        print(frame.f_code)
Now it’s simply a matter of setting it as our trace callback:
sys.settrace(trace_calls)
And executing sample(3,2) should produce
$ python debugger.py
<code object sample at 0x0000000000B46C90, file “.\test.py”, line 123>
Sample: 10
You need the if-statement to filter out function calls. Otherwise you’ll see a whole bunch of things that you don’t care about, especially when printing to the screen. Try it.
The code and frame objects have quite a few fields to describe what they represent. These include things like the file being executed, the function, variable names, arguments, line numbers, and the list goes on. They are fundamental to the execution of any python code and you can go through the language documentation for more details.
What if you want to debug every line?
The trace mechanism will set subsequent callbacks depending on the return value of the first callback. Returning None means that you’re finished, while returning another function effectively sets it as the trace function inside that frame.
Here’s what this looks like:
def sample(a, b):
    x = a + b
    y = x * 2
    print('Sample: ' + str(y))

def trace_calls(frame, event, arg):
    if frame.f_code.co_name == "sample":
        print(frame.f_code)
        return trace_lines

def trace_lines(frame, event, arg):
    print(frame.f_lineno)
Now, if you execute the same code as before, you can see it print the line numbers as you progress through it:
$ python .\test.py
<code object sample at 0x00000000006D4DB0, file ".\test.py", line 5>
6
7
8
Sample: 10
8
Putting a user interface in front of it
Using the sofi python module, you can easily produce a web application that directly interacts with our python code.
Here’s what you would do:
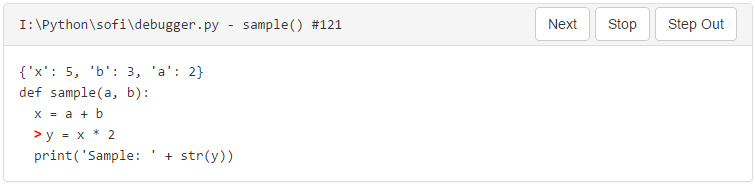
- Show the file, function name and line number being executed.
- Show the code for the current frame with a pointer identifying the line.
- Show the value of the local variables.
- Provide step-by-step execution, meaning you have to block before executing a line until the user clicks a button.
- Add step-over functionality.
- Add a step-out mechanism.
- Provide a method of stopping execution.
From the UI perspective, #1, #2 and #3 can all be handled through a Bootstrap Panel where #1 is the title, and #2 and #3 are part of the body wrapped in samp tags to show proper spacing.
Since the interface will essentially block waiting for user input, and the debugger waits for stop / go commands, it’s a good idea to separate those event loops using our old friend multiprocessing. You can then implement one queue to send debug commands to one process, and a different application queue for UI updates in the other.
Through multiprocessing queues, it’s easy to block the debugger waiting for user commands at the trace_lines function using the* .get()* method.
If the command is given to move to the next line of code (#4), everything stays the same, while stepping out (#6) will change the return value back to the trace_calls function — effectively removing further calls into trace_lines — and stop (#7) will raise a custom exception that will abort execution.
# Block until you receive a debug command
cmd = trace_lines.debugq.get()

if cmd == 'step':
    # continue stepping through lines, return this callback
    return trace_lines

elif cmd == 'stop':
    # Stop execution
    raise StopExecution()

elif cmd == 'over':
    # step out or over code, so point to trace_calls
    return trace_calls

class StopExecution(Exception):
    """Custom exception used to abort code execution"""

    pass
Step-over functionality (#5) is implemented at the trace_calls level by never returning the trace_lines callback.
cmd = trace_lines.debugq.get()

if cmd == 'step':
    return trace_lines

elif cmd == 'over':
    return
Yes, I attached the queue objects as properties of the trace functions to simplify passing things around. Functions being objects is a great idea, though you shouldn’t abuse it either.
Now it’s just a matter of setting up the widgets for displaying data and the buttons for controlling flow.
You can pull out the source code from the code object of the executing frame using the inspect module.
source = inspect.getsourcelines(frame.f_code)[0]
Now it’s a matter of formatting it line by line into div and samp tags, adding an indicator of a different color to the current line (available through f_lineno and co_firstline) and sticking that into a panel widget’s body, along with the string representation of the frame’s locals (which is a simple dictionary anyway):
def formatsource(source, firstline, currentline):
    for index, item  in enumerate(source):
        # Create a div for each line to better control format
        div = Div()

        # Extremly simplified tab index check to add blank space
        if item[0:1] == '\t' or item[0:1] == ' ':
            div.style ='margin-left:15px;'

        # If this currently executing this line, add a red mark
        if index == lineno - firstlineno:
            div.addelement(Bold('> ', style="color:red"))

        # Add the formatted code to the div
        div.addelement(Sample(item.replace("\n", "")))

        # Output the html that represents that div
        source[index] = str(div)

    return "".join(source)
Only thing left to do is register a few event callbacks for button clicks that control execution flow by adding their respective commands to the debug queue. You do this inside a load event handler which triggers after the initial content finishes loading
@asyncio.coroutine
def load(event):
    """Called when the initial html finishes loading"""

    # Start the debug process
    debugprocess.start()

    # Register click functions
    app.register('click', step, selector="#code-next-button")
    app.register('click', stop, selector="#code-stop-button")
    app.register('click', over, selector="#code-over-button")

    # Make sure the display updates
    yield from display()

@asyncio.coroutine
def step(event):
    debugq.put("step")

    # Make sure the display updates
    yield from display()

@asyncio.coroutine
def stop(event):
    debugq.put("stop")

@asyncio.coroutine
def over(event):
    debugq.put("over")
How would this look?
For a view of all of the code put together, check out the sofi-debugger project on GitHub.
Some notes on what you just did
The functions from the sys module mentioned here are implemented in CPython and may not be available in other flavors or interpreters. Make sure to keep this in mind when experimenting.
They are also specifically meant for use with debuggers, profilers or similar trace tools. This means that you should not be messing with them as part of a normal program or you may come across some unintended consequences, especially when interacting with other modules that may specifically target these same interfaces (like actual debuggers).
Diving Deeper
For a deeper dive into the Python language constructs, frames, code objects and the dis module, I emphatically recommend that you set aside some time and go through Phillip Guo’s (@pgbovine) CPython Internals lectures.