

Integrating Pytest Results with GitHub
When joining a new engineering team, one of the first things I do is familiarize myself with the dev and test processes. Especially the tools used to enforce them. In the past 5 years or so, I’ve noticed that a lot of organizations still use older tools that haven’t yet evolved to support modern practices. Even teams that purely develop software can find themselves working around cumbersome systems that hinder instead of enable.
What do I mean by that? Very few of these tools include useful interfaces to leverage integrations with other systems (like REST APIs). Most have no concept of modern dev practices like continuous integration or containerization. Almost all of them want to record pass / fail at a step by step basis as if you’re executing manually. The vast majority are built around a separation between test and dev (some even emphasize it). And a lot of them require the organization to hire “specialists” for the purpose of “customizing” the tool to the team. In my opinion, these types of systems coerce the organization to emphasize blame over quality and team boundaries over productivity.
I’ve been very successful at building long-lived alternatives to these systems in several organizations. I’ve done it enough to know which features are worth including, and which to leave to the test / dev engineers, especially after the advent of continuous integration and delivery.
These days, my advice on development practices has evolved into the following: define a code delivery pipeline, define the proof points that guarantee the required functionality for each stage of the pipeline, then write the tests that validate those points at the highest most customer-facing level possible (forget the classic “test pyramid”), all tests must pass in order for a commit to make it to production. QA experts help define, write and maintain those tests, all of which will run on every code change as it tries to make it through the pipeline.
Now back to my original point about test tracking systems. It’s counter-productive manually add a “test case” to the system with a step-by-step description for every single automated test in your execution framework. It’s even worse if you have to separately add the results per test case, especially when this is a manual process.
The primary reason for justifying this work usually hovers around the ability to look back through history and find the last time something passed, or if it failed, what was the cause. But searching through these systems is usually not intuitive or easy, especially if you have to look through logs (which tend to be attachments to download individually). But how relevant is this practice today? If my pipeline has certain success guarantees, I won’t have to look back too far.
The alternative
It turns out that code repositories like GitHub have added systems around the pull request model that can help us track history. I’ve been using their Statuses API for almost 2 years now and it works very well. You’ve used it too if you integrate with Travis CI or similar systems. This API allows you to add a new status line-item with a “result” of pass, fail, error or in-progress to a pull request. Then you can setup each repository so its branches require these line items to pass before a pull request is eligible for merge.
To be more specific, I’ve written my execution system to report a status per category of tests. When all tests per category complete, it uses the GitHub REST API to report the status, which then includes the result along with a link to a separate site that loads the log output from a database. The site is just another API that returns a pretty HTML page with the log formatted for easy reading.
This system works very well because I can search through all the pull requests in a repository and immediately know which ones pass / failed based on the check mark that GitHub shows in its pages. Opening any of them allows you to look through the statuses of each commit to find which test category passed or failed, and then drill into the details link to view the log output.
This level of integration is great and facilitates quite a bit of Dev / QA interaction that leads to better products. We even have status items for manual tests that the QA folks can pass or fail with a command from our chatops. However, it would be nice to avoid maintaining a separate system that stores logs, especially if you want to store them for eternity. It’s even better if you could trigger actions at a per-status level (like rerunning tests).
GitHub Checks and GitHub Apps
GitHub recently added a new system called the Checks API which allows us to do most of those things and more. And given that my primary test execution framework is Pytest, we can put together an integration that automatically adds a new “annotation” per test along with its result and even a log. Plus, while viewing the checks, the GUI allows us to integrate with user actions, like rerunning.
GitHub also introduced a different integration mechanism: the GitHub App. This is a neat system that allows you to register code as an application that each user can separately install into their account. It makes it very clear what permissions the code will use and allows usage grants per repository. Using the Checks API requires the integration code to operate as a GitHub App.
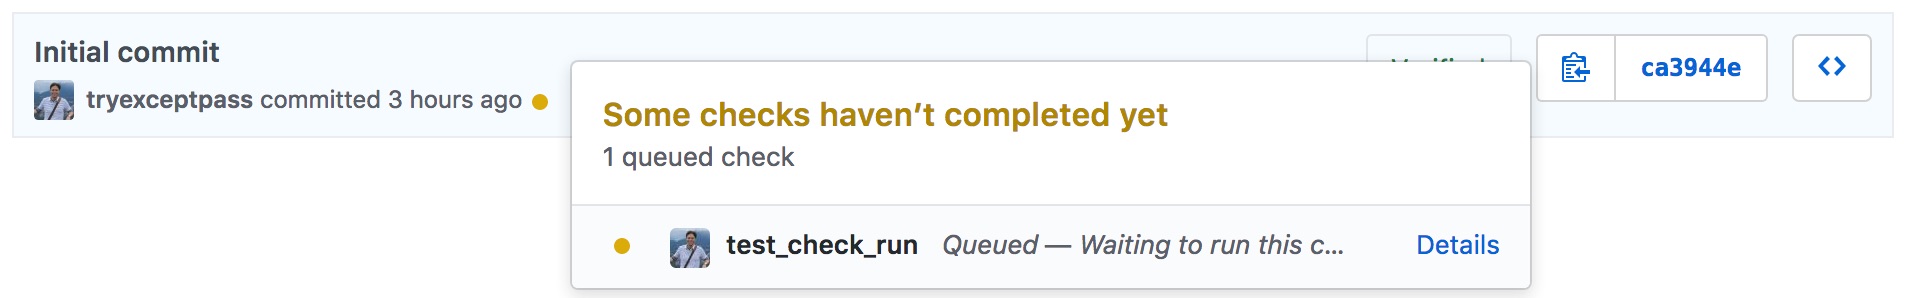
When a repository receives a new commit, GitHub creates a Check Suite and triggers an event that your GitHub App can listen for. With the information from this event (received as a webhook), the app can then create a new Check Run with which to track the status of execution and results. A run seems to be the equivalent of a status item in the Status API that I’ve been using so far. It shows the status for each commit and has links to provide further details that open into an enhanced interface.
You can access the run from any commit inside or outside of a pull request:
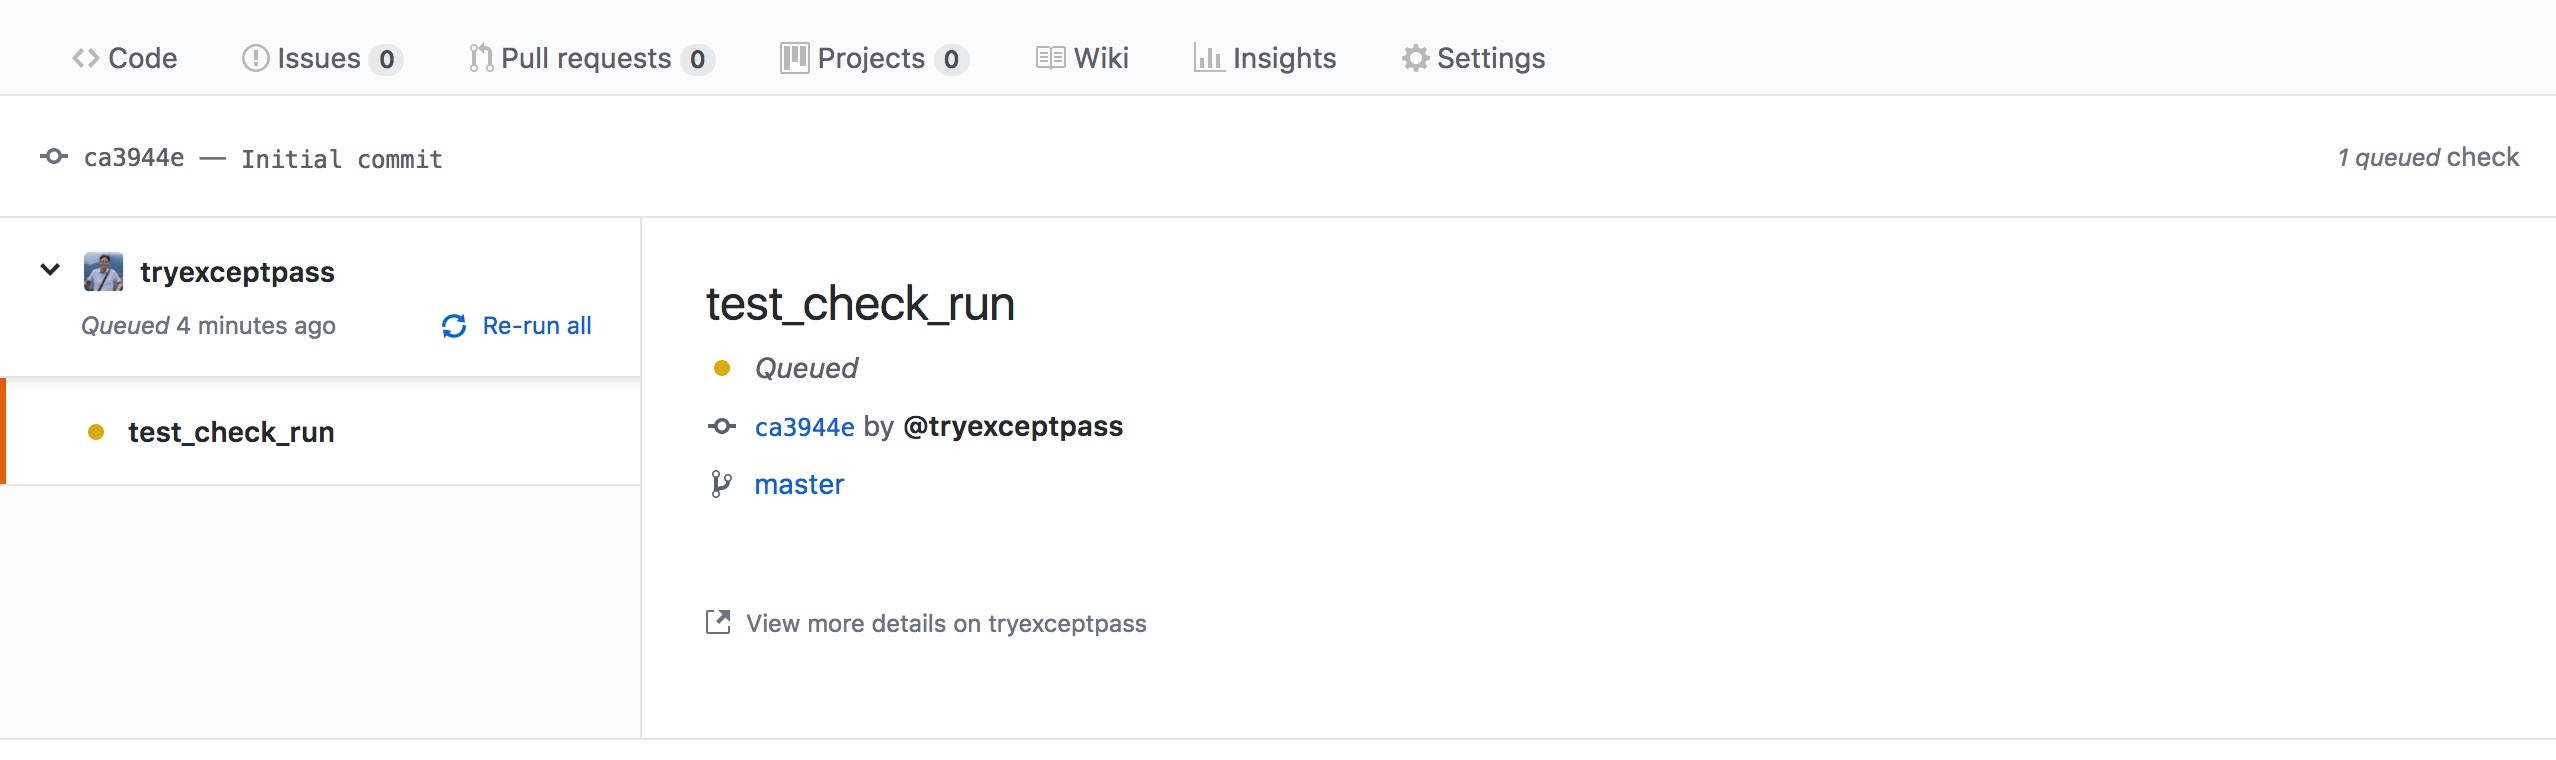
The basic details GUI looks like this:
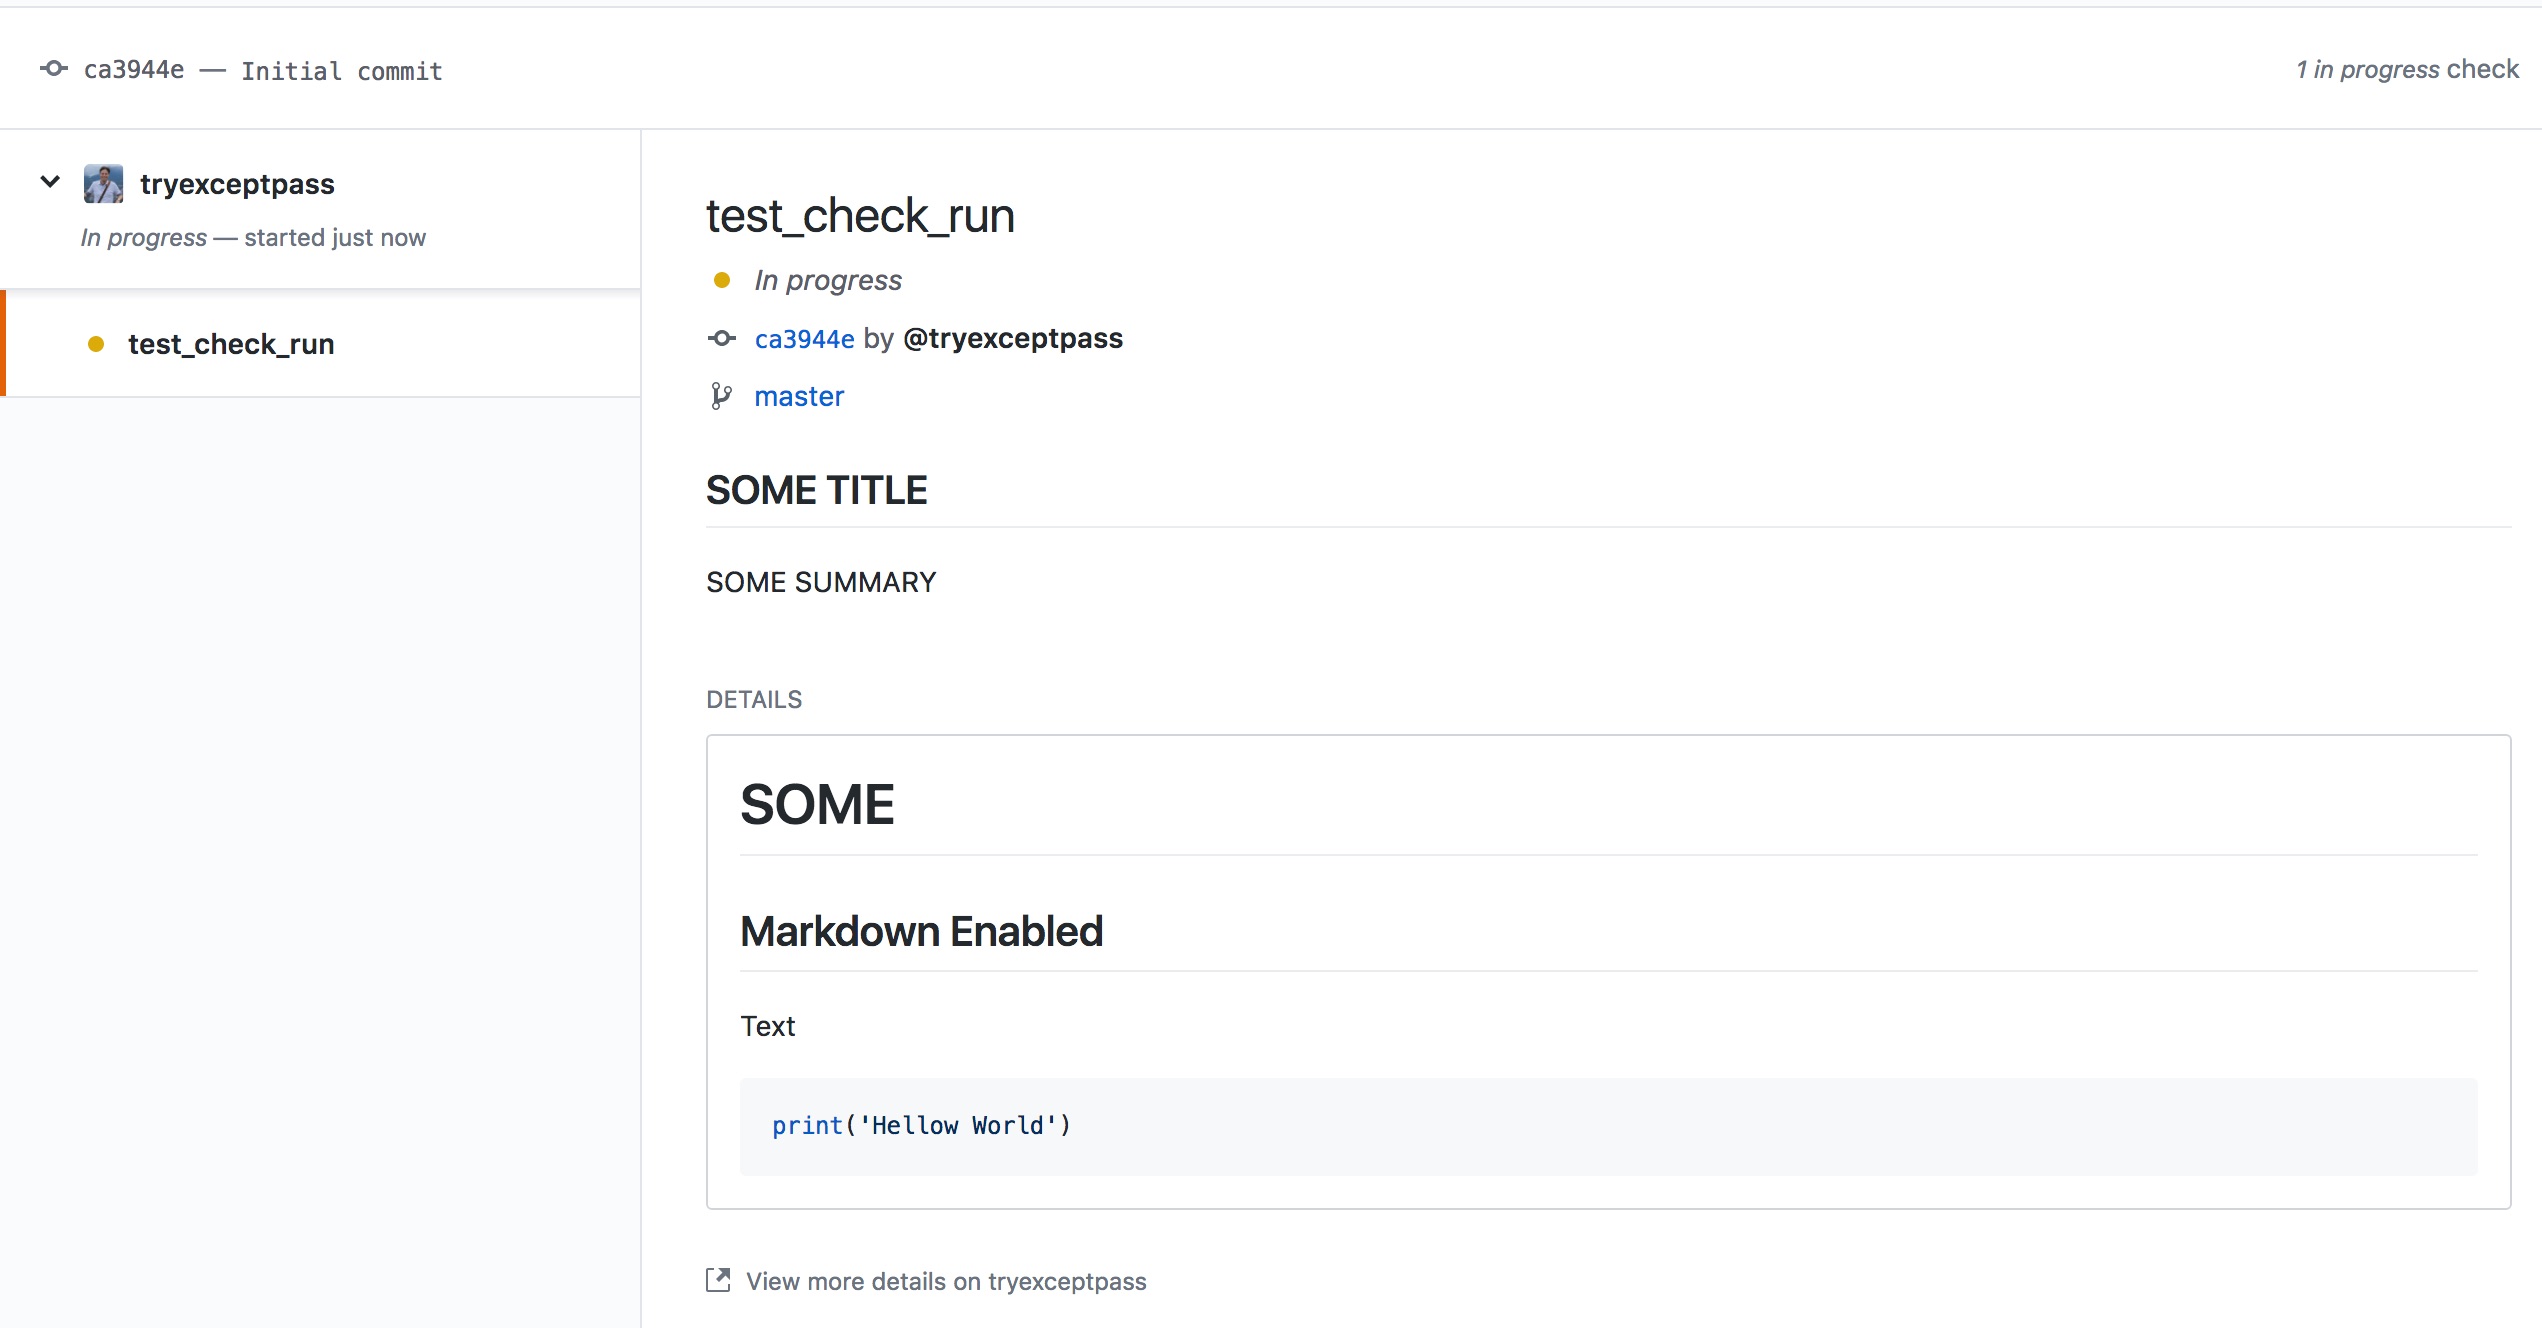
Check run statuses are expanded with several options, but its details is where the magic happens. Each run can have multiple annotations, and each annotation has a type plus further details that help point to specifics (which can even include line numbers).
Here’s an example status with the title, summary and text fields set:
Making a new GitHub App
Following is a summary of the steps required to create a new App. For more information on GitHub Apps, please visit GitHub’s guide at Building GitHub Apps.
- Go to your account’s Developer Settings and select GitHub Apps from the left menu.
- Click the
New GitHub Appbutton. - Fill out the form.
- Since this is a test app, you don’t really have to point the
Homepage URLor theUser authorization callback URLto anything custom. Could point it back to github.com if you like. - The
Webhook URLhas to point to a place where you’ll receive HTTP POSTs with GitHub events. Don’t worry, it doesn’t have to be up and running yet. - Make sure to enable read / write access to the Checks API.
- Take some time to read through the other access permissions, it serves as a great summary of what you can do with GitHub.
- Because this is just for test purposes, select the
Only on this Accountoption.
- Since this is a test app, you don’t really have to point the
- Click
Create GitHubAppto submit the form and complete registration. - Now that the App is registered, it’s time to generate a private key. In the new App’s edit screen (to which the previous step redirected), click “Generate a private key” and store the file in a safe place.
- Take note of the ID located in the
Aboutsection of this same screen. This is yourapp_id, you’ll need it when making REST requests. - The App is now available for use, but you have to enable it in your account. Go to
Install Appon the left side of the page. - Here you’ll see a summary of the permissions being granted to the App (based on selections in step 3), and you may choose the repositories where the app should be active. I suggest limiting it to one or two repos where you can test things.
- Retrieve your installation ID. When you installed the App in your account, that generates what GitHub calls an “installation”. In order to act on behalf of the account with the assigned permissions, you’ll need to authenticate the app as that installation. Doing so requires an extra identifier that’s only available through the REST API (via
GET /app/installations) or through webhook events. Luckily GitHub always stores a subset of the recent events it sent:- Go to the
Advancedsection of the Edit App page. - Click on the
...Next to the latest entry in theRecent Eventssection. - Examine the payload for an
installationentry with anidfield. This is the number you need, yourinstall_id.
- Go to the
Authenticating as the GitHub App
Please note that both the App and the Checks integrations are in developer preview mode and therefore require a special accept header in all requests: application/vnd.github.machine-man-preview+json.
In order to act as the new GitHub App, all HTTP requests to the GitHub REST API require an Authorization header set to Bearer {token}, where token is a JWT signed with the private key saved from step 4 in the previous section. For more details on how this works, visit the guide at Authenticating with GitHub Apps. Here’s a quick snippet that uses PyJWT to generate the token:
import jwt
from datetime import datetime

# Get the current date
now = datetime.now()

token = jwt.encode({
        'iat': now,
        'exp': now + 600,       # Expiration max is 10 mins
        'iss': APP_ID           # This is the app_id from step 6
    },
    PRIVATE_KEY_PATH,           # The path to where you stored the private key .pem file from step 5
    algorithm='RS256'
).decode('utf-8')               # Output of encode is in bytes, so we need to decode it


# Check that things are working by retrieving the list of installations
resp = requests.get(
    f'https://api.github.com/app/installations',
    headers={'accept': 'application/vnd.github.machine-man-preview+json', 'authorization': f'Bearer {token}'}
)

# Response output also contains the installation_id we needed for step 9 in the prev section
Tracking Test Execution
Before going further into the pytest integration, let’s first decide how we want to report results back into GitHub.
Each GitHub check run can have a status of queued, in_progress or completed. Completed runs must then offer a conclusion like success, failed, etc. Following the model from earlier, we’re going to use a check run to track the execution of a category of tests which reports a success result only when all tests pass.
To record specific test details, we’ll use annotations. Since these can only be of type failure, warning or notice, I’ve decided to show passing results as notice. However, you may find it redundant to record passing results because usually what matters is the tests that failed. But having a list of all tests that executed does add value, so I chose to record them one by one. An alternative could be to include the list of all tests in one annotation, with separate ones for each failure.
Here’s an example of all the information (minus annotations) you can include in the check run. Think of it as a test execution report:
Integrating with Pytest
Out of the many test frameworks I’ve used over the years, pytest is definitely the most versatile. It doesn’t require a lot of boiler plate, it’s easy to get started with, and I find its solution to setup and teardown (called fixtures) very helpful, intuitive and reusable. You can use it to test any software codebase, regardless of what language it’s written in. I primarily run it inside docker containers in a large swarm that helps me parallelize execution.
Pytest uses a file called conftest.py to specify fixtures or other configuration settings at the directory level. Meaning that all tests within the directory where conftest.py exists will have access to it. This also works hierarchically. In other words, if you have a parent tests directory and two category1 and category2 directories, all files within each subdirectory can use the definitions in a conftest.py that lives in the tests directory. But each category directory can have their own conftest.py that’s independent from the other.
Test execution goes through three stages:
- setup - invokes all the fixtures that apply to the current test until they reach the
yieldkeyword. This is where you perform initialization functions like prepping databases. - call - executes the actual test while passing any information returned through the yields.
- teardown - continues fixture execution after the yield keyword, which is the cleanup code.
The framework provides many features with which to extend it. We can build functions that tie into test configuration and execution, as well as full blown pip-installable plugins which can in turn provide their own extension features. To keep things simple for our purpose today, we’ll just build on the hook functions. For a detailed list of these hooks, have a look at the Pytest Reference.
In our case, we use pytest_runtest_makereport() which is called as tests go through the three stages of execution. When each stage finishes, pytest will invoke this function passing it two parameters: a pytest.Item and the _pytest.runner.CallInfo. One is the test item currently being worked on, and the other contains call information that includes the execution stage it’s in and a traceback in case of failures.
Documentation is a little sparse in regards to what these objects provide and how to use them. I found what I needed by looking at the source code and experimenting.
Preparing the Test Session
When the test session starts, we have to create the GitHub check run which will contain the test report. This is easy to do with GitHub’s REST API by POSTing a new check run and storing the identifier it returns. As execution progresses, we’ll update that run with the results and annotations. All of this code lives outside the hook functions in the main conftest.py file.
Since the pytest_runtest_makereport() hook gets three separate calls for each of the execution stages, you must internally track the process for each test. I use a dictionary for that, inserting an entry for the current test item which contains another dictionary tracking the results per stage. Every time the function is called, I store the result and verify if it’s at the last stage (teardown), if so then check for the results of the previous stages to determine what type of annotation to add.
Adding Annotations
Updating annotations is also easy with a PATCH request to the check run, deciding what details to provide can be more complicated. The possible fields are: path, start_line, end_line, start_column, end_column, annotation_level, message, title, raw_details.
Note: The API is in preview mode and because of that some of these field names may change. In fact, they already have: path used to be filename, annotation_level used to be warning_level, and there used to be a blob_href required field. Details of these changes and others are in the Changes to the Checks REST API GitHub blog post.
The GitHub API saves us some trouble by not requiring all annotation entries every time we update a run. It simply appends whatever we do include into the annotations list field to the end.
As we make annotations, there’s a few more interesting fields at the check run level that you’ll also want to update:
status- this should be set toin_progresswhile tests are executing. You can set tocompletedwhen the session ends, though I’ve been setting it at the end of each result.conclusion- this is where you set the entire test run tosuccessorfailure. You may also consideraction_requiredfor pytest sessions that end with errors instead of failures.completed_at- should have the timestamp of your update, I format it like this:datetime.now().strftime('%Y-%m-%dT%H:%M:%SZ').output- this is the field that contains another dictionary with yourannotations. Think of it as the results report, complete with atitle,summaryandtextfields that you can write in markdown.actions- here you set user actions that will show as links in the GUI. There’s a maximum of three actions, and each one requires alabel,identifieranddescription. When the user clicks any of these links, your application receives another webhook with theactionfield set to arequested_actionthat includes the contents ofidentifierprovided in this structure. For details on how this works, have a look at GitHub’s Request further actions from a check run.
Annotations for Passing Tests
If you remember from earlier, we decided on recording all passing results in their own notice annotations. This is fairly straight forward:
path- the relative file path that contains the test is available in the first entry of the item’s location tuple:item.location[0].start_lineandend_line- since this annotation is unrelated to a specific line item, we set these to 0.start_columnandend_column- these are not required.annotation_level- already decided this should be set tonoticefor passing results.message- I simply write “Passed” here, but feel free to add something more descriptive if needed.title- lets use the test function name, which is the last entry in the location tuple:item.location[-1].raw_details- this is not a required field and I chose to leave it blank.
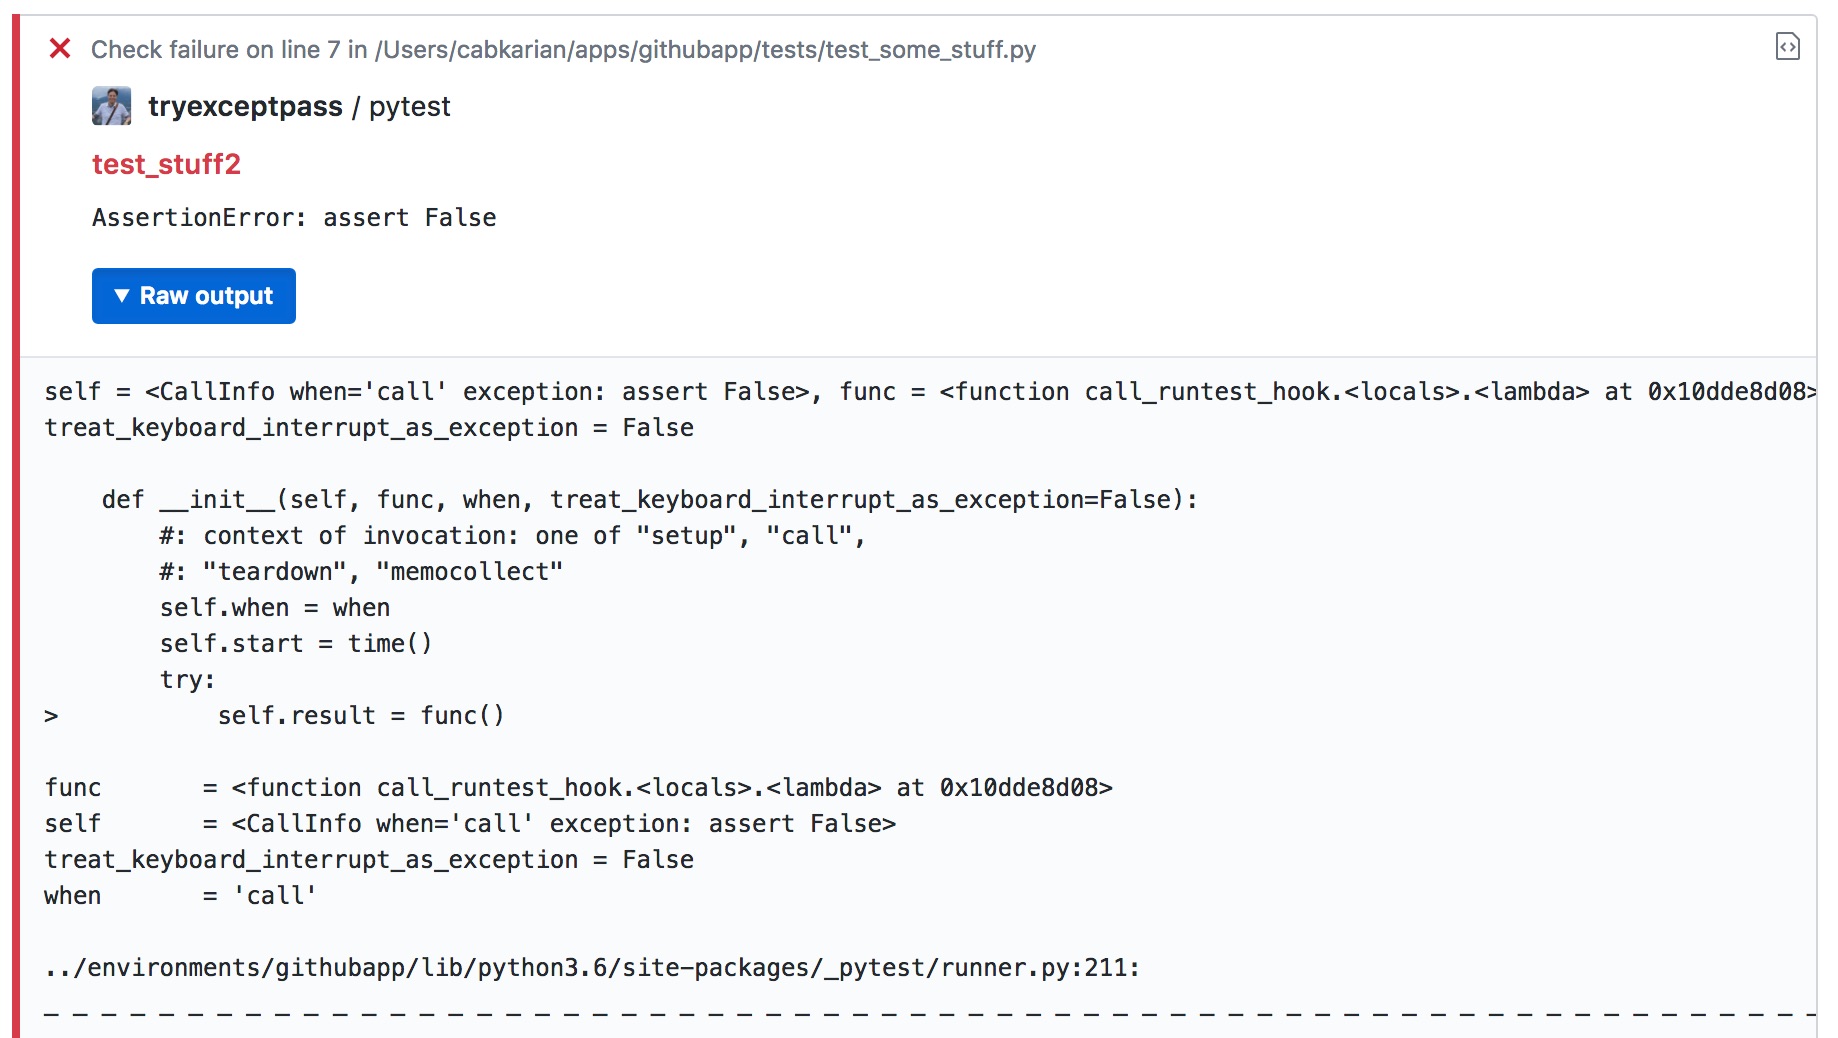
Annotations for Failing Tests
This gets a little trickier because we want to extract tracebacks and there are many abstractions of those objects. Some are provided by pytest, some by core python, and some have cyclical references. At the time of this writing, I still don’t have the extraction trimmed as I would like it, but it does provide all the information I need. Though some of it is irrelevant because it includes calls from the pytest framework itself.
path- the traceback contains the file that actually threw the exception (as opposed to the file containing the test). You can get it withtraceback_entry = call.excinfo.traceback.getcrashentry()andtraceback_entry.frame.code.raw.co_filenamecontains the path info. Notice that it’s using the code object from the python execution frame.start_lineandend_line- available from the traceback entry’slinenoproperty, and set theend_lineto the same number.message- stores the contents ofcall.excinfo.exconly(), which is the descriptive name of the exception thrown.raw_details- this is where I put the full traceback retrieved fromstr(call.excinfo.getrepr(showlocals=True, funcargs=True)). Theshowlocalsparameter will display the value of the local variables in each of the calls, and thefuncargswill display the values of the function arguments in each call.
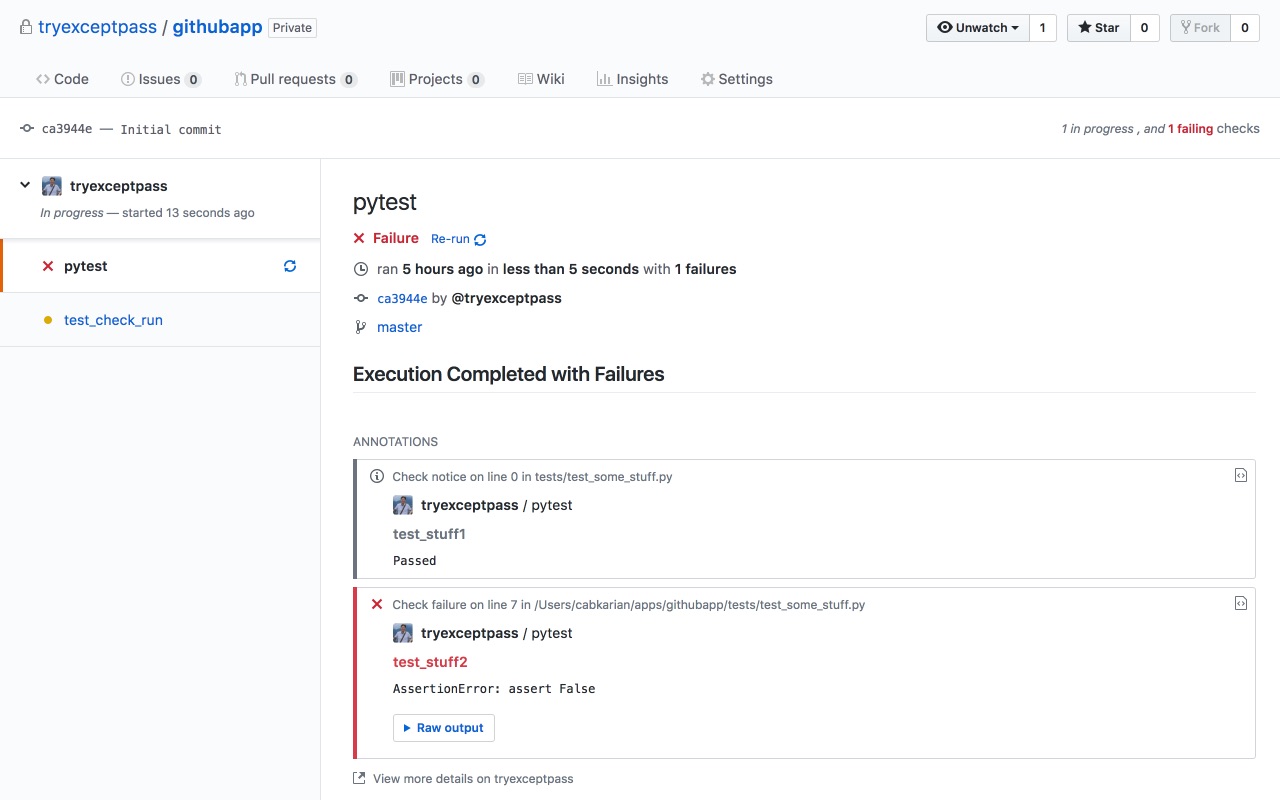
Here’s an example of what a failed annotation would look like with these fields:
Putting it together
Nothing better than looking at some code right? The following block is our conftest.py, it implements everything from the discussion we’ve had so far and uses a GitHubApp wrapper module I built around the REST API which is available in this my githubapp project. This repo is where I took the screenshots shown here, so it’s a good place to get a feel for how this Checks interface works.
import os
from github import GitHubApp
from datetime import datetime


APP_ID = os.environ['GITHUBAPP_APP_ID']
INSTALL_ID = os.environ['GITHUBAPP_INSTALL_ID']
PRIVATE_KEY = os.environ['GITHUBAPP_KEY']
CHECK_RUN_HASH = os.environ['CHECK_RUN_HASH']

GITHUB_USER = 'tryexceptpass'
GITHUB_REPO = 'githubapp'
CHECK_RUN_NAME = 'pytest'


gh = GitHubApp(APP_ID, install_id=INSTALL_ID, private_key=PRIVATE_KEY)

run_id = gh.create_check_run(GITHUB_USER, GITHUB_REPO, CHECK_RUN_NAME, CHECK_RUN_HASH)['id']

gh.update_check_run(
    GITHUB_USER,
    GITHUB_REPO,
    run_id,
    status='in_progress',
    started_at=datetime.now().strftime('%Y-%m-%dT%H:%M:%SZ')
)

has_failed = False
outcomes = {}


def pytest_runtest_makereport(item, call):
    global has_failed

    # print(run_id, item.location, call.when, call.result if call.excinfo is None else call.excinfo.traceback)

    if item.location[-1] not in outcomes:
        outcomes[item.location[-1]] = {'setup': None, 'call': None, 'teardown': None}

    if call.excinfo is None:
        outcome = 'passed'
    else:
        outcome = 'failed'
        has_failed = True

    outcomes[item.location[-1]][call.when] = outcome

    if call.excinfo is None:
        if call.when == 'teardown':
            outcome = outcomes[item.location[-1]]

            if outcome['setup'] == 'passed' and outcome['call'] == 'passed' and outcome['teardown'] == 'passed':
                gh.update_check_run(
                    GITHUB_USER,
                    GITHUB_REPO,
                    run_id,
                    status='completed',
                    conclusion='failure' if has_failed else 'success',
                    completed_at=datetime.now().strftime('%Y-%m-%dT%H:%M:%SZ'),
                    output={
                        'title': 'Execution Completed with Failures' if has_failed else 'Execution Completed Successfully',
                        'summary': '',
                        # 'text': "# SOME\n## Markdown Enabled\nText",
                        'annotations': [{
                            'path': item.location[0],
                            'start_line': 0,
                            'end_line': 0,
                            # 'start_column'	               # The start column of the annotation.
                            # 'end_column'	                   # The end column of the annotation.
                            'annotation_level': 'notice',      # notice, warning, or failure.
                            'message': 'Passed',
                            'title': item.location[-1],
                            # 'raw_details': '',
                        }]
                    }
                )

    else:
        entry = call.excinfo.traceback.getcrashentry()

        gh.update_check_run(
            GITHUB_USER,
            GITHUB_REPO,
            run_id,
            status='completed',
            conclusion='failure',
            completed_at=datetime.now().strftime('%Y-%m-%dT%H:%M:%SZ'),
            output={
                'title': 'Execution Completed with Failures' if has_failed else 'Execution Completed Successfully',
                'summary': '',
                # 'text': "# SOME\n## Markdown Enabled\nText",
                'annotations': [{
                    'path': entry.frame.code.raw.co_filename,
                    'start_line': entry.lineno,
                    'end_line': entry.lineno,
                    # 'start_column'	               # The start column of the annotation.
                    # 'end_column'	                   # The end column of the annotation.
                    'annotation_level': 'failure',     # notice, warning, or failure.
                    'message': call.excinfo.exconly(),
                    'title': item.location[-1],
                    'raw_details': str(call.excinfo.getrepr(showlocals=True, funcargs=True)),
                }]
            }
        )
Receiving the GitHub Events
This is very easy to do with python, all you need is to run an HTTP server with your favorite REST framework listening for a POST request on any URL. Just update the GitHub App webhook URL field with the correct address and you’ll start receiving events.
In the future, when GitHub releases these interfaces to production, I’ll look at turning the githubapp repo into something pip-installable for folks to use. I’ll try to do the same for the pytest integration by turning it into a real pytest plugin.
If you have any questions, comments or suggestions, feel free to ping me on twitter or gitter.